
Benchmarks
Felix ships a reproducible benchmark harness (latency-demo) that measures
end-to-end pub/sub performance — client publish → broker fanout → client
delivery — over real QUIC connections with TLS 1.3. This page documents the
methodology, current results, the transport levers that matter, and how to
compare Felix against other pub/sub systems fairly.
Running the benchmark
Section titled “Running the benchmark”# Full matrix: latency-focused (batch=1) then throughput-focused (batch=64)cargo run --release -p broker --bin latency-demo --all-features
# Single casecargo run --release -p broker --bin latency-demo --all-features -- \ --warmup 500 --total 20000 --payload 1024 --fanout 10 --batch 64Methodology
Section titled “Methodology”Numbers are only useful if they are honest. The harness enforces:
- Truthful delivery windows. Delivered throughput is computed from publish start to the instant the last event actually arrived — not to when drain tasks are joined. Trailing bookkeeping never inflates the denominator.
- Lossless backpressure in both profiles. The throughput profile
(batch > 1) runs with blocking queues end-to-end and bounded ingress waits
(
pub_ingress_wait), so the publisher is paced to the pipeline’s sustainable rate. The latency profile (batch = 1) blocks the broker’s core per-subscriber queue and the client’s own subscriber channel, not just the writer-lane queue below them — both defaulted toDropNewand could drop warmup/measurement messages under load before that was tightened. In both profiles every message is delivered (unaccounted 0). A subscriber that times out now fails the run rather than abandoning its remaining events, so a shortfall cannot be quietly reported as shedding. A number measured while shedding is not a throughput or latency number. - Latency mode measures per-message RTT. The latency profile (batch = 1) publishes with per-message acks, measuring full round-trip behavior rather than fire-and-forget enqueue rates.
- Warmup excluded. Handshake, stream setup, path-MTU discovery, and congestion ramp are absorbed by warmup messages before measurement starts.
- Fanout counted honestly.
delivered throughputcounts every subscriber delivery;per-sub throughputdivides by fanout.
A run must exceed the send window
Section titled “A run must exceed the send window”The single easiest way to publish a wrong throughput number: any batched run whose total volume fits inside the 64 MiB QUIC connection send window is absorbed by buffers before backpressure appears, so the harness reports buffer-fill rate rather than sustained throughput. A 1 KiB run once appeared to do 358 MB/s and actually sustained 74.9 MB/s.
Two guards now exist. latency-demo prints a warning when a batch > 1 run’s
volume is within ~2× the send window, and the matrix runner scales message
count per payload so every throughput cell clears it. Rule of thumb when
running by hand: payload × total should comfortably exceed 128 MiB.
One session at a time
Section titled “One session at a time”data/raw/latency_demo_runs.jsonl is append-only, so it accumulates every run
ever performed on the machine — across commits, branches, and code states.
Each matrix invocation therefore stamps a session_id, and
normalize_and_aggregate.py derives from the latest session only by
default. Pass --session all to include history, or --session <id-prefix>
to pick one. Without this the derived CSVs and every chart built from them mix
unrelated code states, which previously produced charts holding a single bar
with every other payload marked “no data”.
Results
Section titled “Results”Measured on an Apple M4 Max (macOS, APFS, loopback), release build, TLS 1.3 enabled — QUIC always encrypts, so per-packet crypto is inside every number here. All runs are sized past the 64 MiB QUIC send window, so these are sustained rates rather than buffer-fill (see methodology).
Latency profile (batch = 1, per-message ack)
Section titled “Latency profile (batch = 1, per-message ack)”Table: medians of 5–10 trials per cell from the full matrix. Charts: refreshed
from the post-fix task perf:fast session (3 trials per cell); the two agree
within noise.
| Payload | Fanout 1 (p50 / p99 / p999) | Fanout 10 (p50 / p99 / p999) |
|---|---|---|
| 0 B | 127 / 165 / 214 µs | 184 / 278 / 340 µs |
| 256 B | 128 / 166 / 204 µs | 237 / 327 / 369 µs |
| 1 KiB | 131 / 176 / 251 µs | 247 / 351 / 417 µs |
| 4 KiB | 136 / 176 / 216 µs | 269 / 399 / 483 µs |
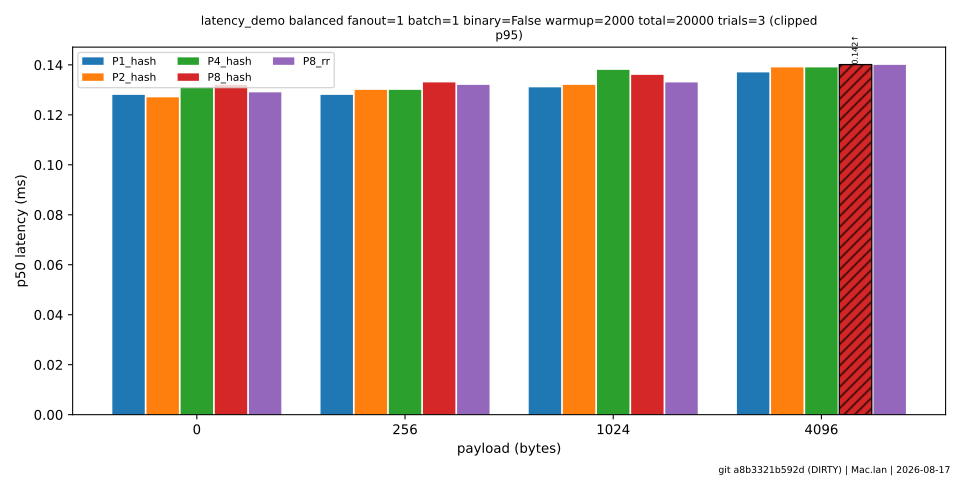
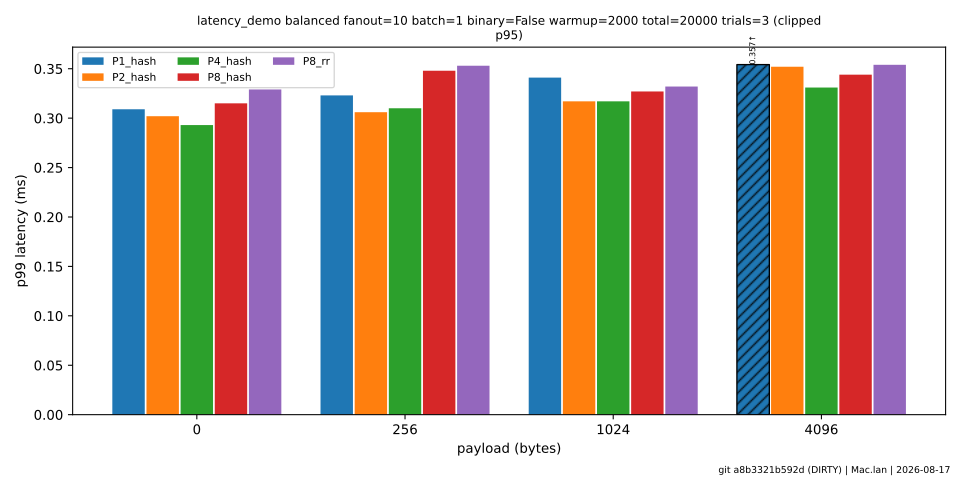
Fanout-10 tails improved sharply with the transport scheduling work: p99 went from ~1.05–1.13 ms to 278–399 µs, and p999 from 1.32–2.09 ms to 340–483 µs — roughly 3–4× better tail latency at fanout 10, with fanout 1 also improving (p99 199–212 µs → 165–176 µs). This profile is stable: 85% of cells hold a p90/p10 trial spread under 1.5×.
Throughput profile (batch = 64, binary, lossless, zero drops)
Section titled “Throughput profile (batch = 64, binary, lossless, zero drops)”Seven trials per payload at fanout 1, fresh process per trial, idle machine, default publisher pool (4 connections × 2 streams).
| Payload | Median | Payload rate | Slowest trial | Spread |
|---|---|---|---|---|
| 256 B | 1,400,008 msg/s | 358 MB/s | 1,361,493 | 1.05× |
| 1 KiB | 450,455 msg/s | 461 MB/s | 425,703 | 1.12× |
| 4 KiB | 124,004 msg/s | 508 MB/s | 121,968 | 1.03× |
| 16 KiB | 30,707 msg/s | 503 MB/s | 30,120 | 1.04× |
Against the pre-fix ceiling of ~73 MB/s — which was flat across every payload size — that is roughly a 7× improvement, and the byte rate now rises with payload size instead of pinning to a constant.
These are macOS figures, and the ceiling they describe is a macOS pathology.
Spot-checked on Linux (4-CPU container, 1 KiB × batch 64 × fanout 1), the
pre-fix baseline already sustains ~628 K msg/s ≈ 643 MB/s — above what
macOS reaches with every fix applied. The dedicated I/O runtime pool is
therefore enabled on macOS only; on Linux it measures slower (see
FELIX_IO_RUNTIME_THREADS in the
environment variable reference).
Linux has since been measured on real hardware (Azure D16ads_v5, 8 physical
EPYC cores, Ubuntu 24.04): 1.17 GB/s at 4 KiB × batch 64 × fanout 1, about
2.3× the macOS figure above at the same shape. That run also uncovered a
delivery-stalling defect in the loopback MTU guarantee on Linux, now fixed by
capping the guaranteed size at 4 KiB off macOS. No Linux table is published
here yet: those numbers came from direct harness invocations rather than a full
run_latency_matrix.py session, so they lack the per-run provenance every row
on this page carries. The performance case study
has the measurements and their caveats.
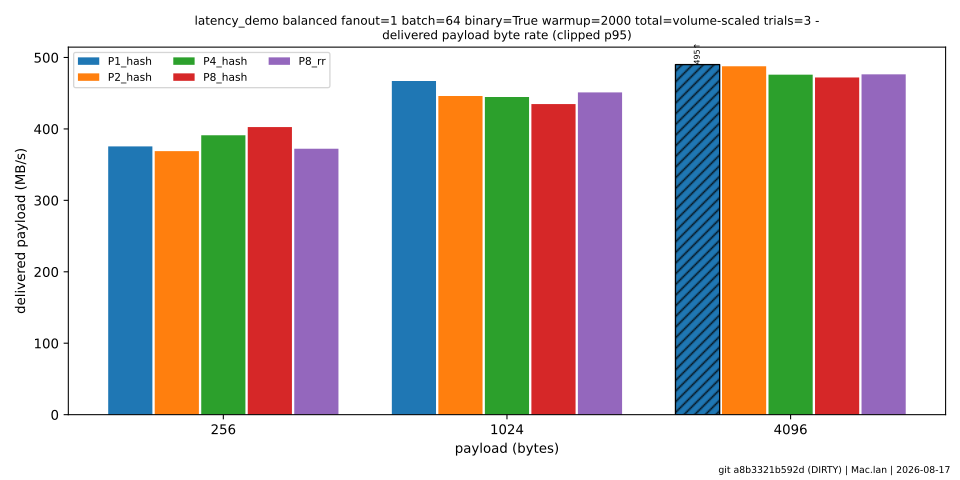
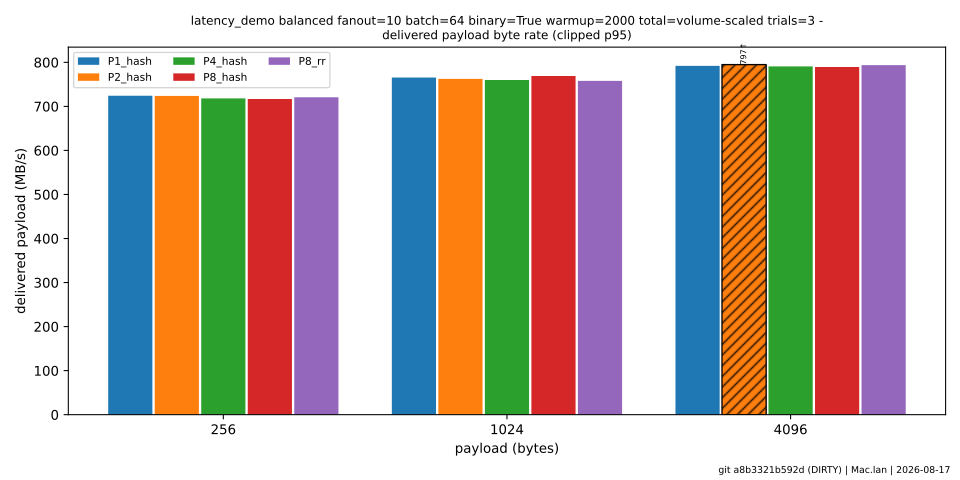
The charts come from the same post-fix matrix session as the latency charts above (3 trials per cell, fresh session, run-size floor past the QUIC send window). Publisher presets are within a few percent of each other at every payload — connection count is not a throughput lever, as the QUIC transport page explains.
Historical cross-platform comparison
Section titled “Historical cross-platform comparison”| Payload | Fanout | macOS p50 / p99 / p999 | Linux p50 / p99 / p999 |
|---|---|---|---|
| 0 B | 1 | 121 / 199 / 311 µs | 82 / 116 / 175 µs |
| 256 B | 1 | 128 / 208 / 263 µs | 91 / 172 / 241 µs |
| 1 KiB | 1 | 124 / 212 / 329 µs | 96 / 161 / 223 µs |
| 0 B | 10 | 460 µs / 1.09 / 1.49 ms | 98 / 147 / 193 µs |
| 256 B | 10 | 447 µs / 1.13 / 2.09 ms | 99 / 148 / 181 µs |
| 1 KiB | 10 | 444 µs / 1.05 / 1.32 ms | 142 / 720 µs / 4.96 ms |
Historical throughput (pre-fix, mixed platforms)
Section titled “Historical throughput (pre-fix, mixed platforms)”| Payload | Fanout | macOS JSON | Linux JSON | Linux binary |
|---|---|---|---|---|
| 0 B | 1 | 650 K | 1.29 M | 1.23 M |
| 0 B | 10 | 2.46–2.58 M | 1.19 M | 2.92 M |
| 1 KiB | 1 | 244–263 K | 178 K | 442 K |
| 1 KiB | 10 | 410–460 K | 1.54 M | 1.57 M |
| 4 KiB | 1 | 62–87 K | 97 K | 120 K |
| 4 KiB | 10 | ~107 K | 499–561 K | 566–590 K |
Every row completes with delivery drops 0: these are sustainable rates under
end-to-end backpressure, not burst rates measured while shedding load. Rates
count subscriber deliveries. The Linux 4 KiB × fanout 10 binary result delivers
about 2.3 GB/s of payload.
The 1 KiB × fanout 10 Linux figures are averages of five interleaved runs: JSON averaged 1.541 M msg/s and binary averaged 1.569 M msg/s. Binary won three of five runs, but the averages are within 2%, confirming that the earlier single-run JSON lead was variance rather than an encoding-path reversal.
Encode-once fanout CPU efficiency
Section titled “Encode-once fanout CPU efficiency”An A/B run of 200 K deliveries at 1 KiB × fanout 10 showed broker/client user-space CPU falling from 1.43–1.61 s to 0.58–0.67 s after shared event-frame fanout: roughly 60% less user CPU per delivered message. Delivered throughput remained within variance at 410–431 K msg/s because macOS loopback was dominated by UDP kernel time; the same change improved 4 KiB × fanout 10 p99 latency from 365 ms to 221 ms.
Linux GSO closes that kernel-bound gap decisively: 4 KiB × fanout 10 reaches
499–561 K JSON and 566–590 K binary delivered msg/s, up to roughly 5x the
macOS JSON rate. For the representative 1 KiB × fanout 10 binary workload,
/usr/bin/time -v reported 1.23 s user time and 0.33 s system time over
0.59 s wall time. The equivalent macOS run used about 0.6 s user and 3.3 s
system time. System time therefore fell by about 90%, flipping the workload
from roughly 5.5:1 system-dominated to 3.7:1 user-dominated.
This Linux workload is no longer syscall-bound. The “user-space scheduling and synchronization” target this paragraph used to predict has since been confirmed and fixed: throughput was clocked by scheduler wakeup latency on the QUIC driver tasks — roughly one cross-thread wakeup chain per datagram — and isolating those drivers onto dedicated single-threaded runtimes (plus pump colocation and ACK-frequency tuning) raised sustained macOS loopback throughput ~7.5×. See Concurrency internals for how that placement works.
The transport levers that matter
Section titled “The transport levers that matter”These findings came out of profiling the QUIC path and are wired into
felix-transport defaults; each has an environment override:
| Lever | Default | Why it matters |
|---|---|---|
FELIX_MTU_UPPER_BOUND |
16384 | Path-MTU discovery bound. quinn’s stock 1452 caps loopback/jumbo paths at Ethernet size; bounding at the real path MTU (loopback lo0 = 16384) cut per-byte syscall and crypto costs ~7x for byte-heavy workloads. Small-message workloads can prefer ~4096 (finer ACK clocking, measured ~1.5x for 0-byte messages). |
FELIX_INITIAL_MTU |
1200 | RFC-safe starting datagram size. Raise on known-good paths to skip discovery entirely. |
FELIX_INITIAL_CWND |
Quinn RFC default | Optional initial congestion-window override for trusted low-loss paths. Quinn raises its minimum window to two datagrams when path-MTU discovery finds a larger MTU; the measured default workloads did not benefit from a larger initial burst. |
FELIX_UDP_SEND_BUFFER / FELIX_UDP_RECV_BUFFER |
8 MiB | Socket buffers absorb bursts; kernel-level drops surface as QUIC retransmits and tail-latency spikes. Applied best-effort (halved until the OS accepts). |
FELIX_MAX_UDP_PAYLOAD |
65527 | Receive-side datagram cap. Must exceed the peer’s discovered MTU or large datagrams are silently rejected. |
FELIX_IO_RUNTIME_THREADS |
CPU parallelism | Quinn’s driver tasks run on a pool of dedicated single-threaded runtimes (one endpoint per runtime), isolated from application tasks. Driver re-poll latency is the transport’s throughput ceiling, and this isolation is the single largest lever found (~7.5× sustained on macOS loopback). 0 restores the old shared-runtime behavior. In-process multi-endpoint setups prefer a small pool; latency-demo pins 2. |
FELIX_ACK_ELICITING_THRESHOLD |
20 | ACK-frequency extension (quinn peers): ACK at most every N ack-eliciting packets instead of every other, with a 2 ms max ACK delay. Each reverse-path ACK costs a datagram plus its wakeup chain; ~+15% throughput measured. FELIX_ACK_FREQ_DISABLE=1 restores stock quinn ACK behavior. |
Broker-side levers (see Configuration):
pub_inflight_bytes (ingress byte budget), pub_ingress_wait (lossless
backpressure vs. shed-on-overload), subscriber queue policies
(block / drop_new / drop_old) and depths, and core_shards
(FELIX_CORE_SHARDS) — thread-per-core stream ownership: each stream’s
publish worker and lane feeders run on a dedicated core-pinned runtime
(Linux pinning; dedicated threads elsewhere). Measured lossless (zero drops):
+27% on a 4-stream × fanout-4 workload (1.24M → 1.59M msg/s, unpinned macOS);
on Linux (devcontainer), +25% single-stream (1 KiB × fanout 10: 1.63M → 2.04M
msg/s) and parity-to-2.5× multi-stream with high environment variance — never
below baseline in any run. Caveat: the 2026-08 investigation found these
core_shards gains were likely measured under the buffer-absorption artifact
(run volumes inside the send window). Re-measured on the fixed pipeline in
the workload the feature targets (4 streams × fanout 4 × 1 KiB × batch 64,
five fresh runs per arm, macOS): shards 0 median 661 K msg/s delivered,
shards 4 median 668 K — +1%, within run-to-run variance. The off-by-default
setting stands; treat core_shards as a placement experiment to validate on
your own hardware, not a general throughput lever.
Saturation behavior
Section titled “Saturation behavior”Felix’s production defaults favor bounded latency with visible overload:
subscriber queues default to drop_new, so an overloaded subscriber sheds
(counted in felix_subscribe_dropped_total) instead of growing unbounded
backlog. Flip to lossless pacing per deployment with
FELIX_SUB_QUEUE_POLICY=block + FELIX_PUB_INGRESS_WAIT=1 when producers
should slow down rather than lose events.
Comparing against other pub/sub systems
Section titled “Comparing against other pub/sub systems”Cross-system numbers are only meaningful when measured side-by-side on the same hardware, same payload sizes, same fanout, and same delivery guarantees. Published figures for other brokers vary by an order of magnitude across hardware and configurations, so treat any single citation with suspicion — including ours. Structural differences to keep in mind:
- Transport & encryption. Felix runs QUIC with mandatory TLS 1.3 — per-packet crypto is included in every number above. NATS/Redis/Kafka benchmarks are typically plaintext TCP; enabling TLS on those systems materially changes their numbers.
- Delivery model. The Felix numbers above are lossless, backpressured, fanout-counted rates. Many published pub/sub benchmarks report publisher enqueue rates or allow silent slow-consumer drops (e.g. Redis client output buffer limits, NATS slow-consumer disconnects).
- Batching. Kafka-class systems trade latency for batch throughput; compare them against Felix’s batch=64 profile, not the latency profile.
For a like-for-like harness against NATS on the same machine:
# NATS side (requires nats-server + nats CLI)nats-server &nats bench benchsubject --pub 1 --sub 10 --size 1024 --msgs 100000
# Felix side, matching shapecargo run --release -p broker --bin latency-demo --all-features -- \  --warmup 500 --total 100000 --payload 1024 --fanout 10 --batch 64
Compare delivered (per-subscriber × fanout) rates and tail latencies, and match TLS configuration on both sides before drawing conclusions.
Continuous benchmarking
Section titled “Continuous benchmarking”Three CI workflows keep this data honest and current, rather than relying on someone remembering to re-run the harness by hand:
.github/workflows/perf-pr.yml— on every PR, builds and benchmarks both the PR’s merge-base and the PR head back-to-back on the same runner instance (a small fast subset, not the full matrix below), then posts a PR comment comparing them via a Welch’s t-test (scripts/perf/compare_benchmarks.py). Running both sides on the same runner controls for GitHub Actions’ shared/virtualized runner noise far better than comparing against a historical stored value. Advisory only — it does not block merging..github/workflows/perf-publish.yml— on every merge tomain, runs the same fast subset once and publishes it as a historical time series (viabenchmark-action/github-action-benchmark, stored on thebenchmark-databranch) so trends over time are browsable..github/workflows/perf-comprehensive.yml— the full matrix below, on a weekly schedule or manual dispatch (too slow — roughly 1,000 individual runs — for every PR or every merge). Produces the artifacts used to regenerate this page; see below.
Historical dashboards
Section titled “Historical dashboards”Every successful performance publish updates the live dashboards on GitHub Pages:
The dashboards are generated by github-action-benchmark, stored on the
benchmark-data branch, and copied into the documentation artifact whenever
the Pages workflow runs. Each chart includes:
- the latest result and its percentage change from the prior rolling median;
- all-history and configurable prior-commit median reference lines;
- a one-standard-deviation noise band from the five trials;
- the existing regression-alert threshold relative to the previous commit;
- best, worst, and latest coefficient-of-variation summaries;
- markers when the benchmark configuration fingerprint changes; and
- zero-based/trend-focused axis and annotation controls.
The alert line is a regression threshold, not a production SLO. Hover a point for trial count, mean, standard deviation, runner details, Rust version, measurement semantics, and configuration fingerprint.
Regenerating this page’s data
Section titled “Regenerating this page’s data”# Single case, quick sanity checkcargo run --release -p broker --bin latency-demo --all-features -- \ --warmup 500 --total 20000 --payload 1024 --fanout 10 --batch 64
# Full matrix (scripts/perf/presets.yml) + aggregation + charts + markdown.# Same pipeline as the perf-comprehensive.yml workflow.pip install -r scripts/perf/requirements.txtpython3 scripts/perf/run_latency_matrix.pypython3 scripts/perf/normalize_and_aggregate.pypython3 scripts/perf/make_charts.pypython3 scripts/perf/render_markdown_snippets.py# -> charts/latency_demo/latency_demo_snippet.mdKey output fields: delivered throughput (all subscribers), delivered per-sub throughput, p50/p99/p999 (per-message publish→delivery latency),
delivery drops (must be 0 in both profiles — see the methodology note
above), publish submit throughput (client-side enqueue rate — an upper
bound, not a delivery claim).